lapply: How to Replace for loops in R to create Several Plots
StatistikinDD
0:00 / 0:00
lapply: How to Replace for loops in R to create Several Plots
3 241 просмотр · 4 года назад
StatistikinDD
4,68 тыс. подписчиков
3 241 просмотр · 4 года назад
For loops are common in other programming languages and also possible in R. However, for most use cases there are more efficient, more elegant and more "R-like" approaches to solving the same tasks.
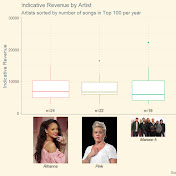
Here we create several plots for subsets of our data, first using a for loop, then replacing it with an lapply call.
Thumbnail image credit to pexels.com: Engin Akyurt
Code can be found here: https://github.com/fjodor/functional-...
Contact me, e. g. to discuss (online) R workshops / trainings / webinars:
LinkedIn: / wolfriepl
Twitter: / statistikindd
Xing: https://www.xing.com/profile/Wolf_Riepl
Facebook: / statistikdresden
https://statistik-dresden.de/kontakt
R Workshops: https://statistik-dresden.de/r-schulu...
Blog (German, translate option): https://statistik-dresden.de/statisti...
Playlist: Music chart history
• Music Chart History
